Oversight Cockpit overview
The Oversight Cockpit is Medipyxis's operational-intelligence surface for administrators, medical directors, and clinical managers. It is a geographic heat map: it plots your operation on a map so you can see where patients and clinicians are, and where revenue is coming from.
Open it from the Analytics menu; the map lives at /oversight/heat-map. Access is gated by the Oversight Cockpit feature permission.
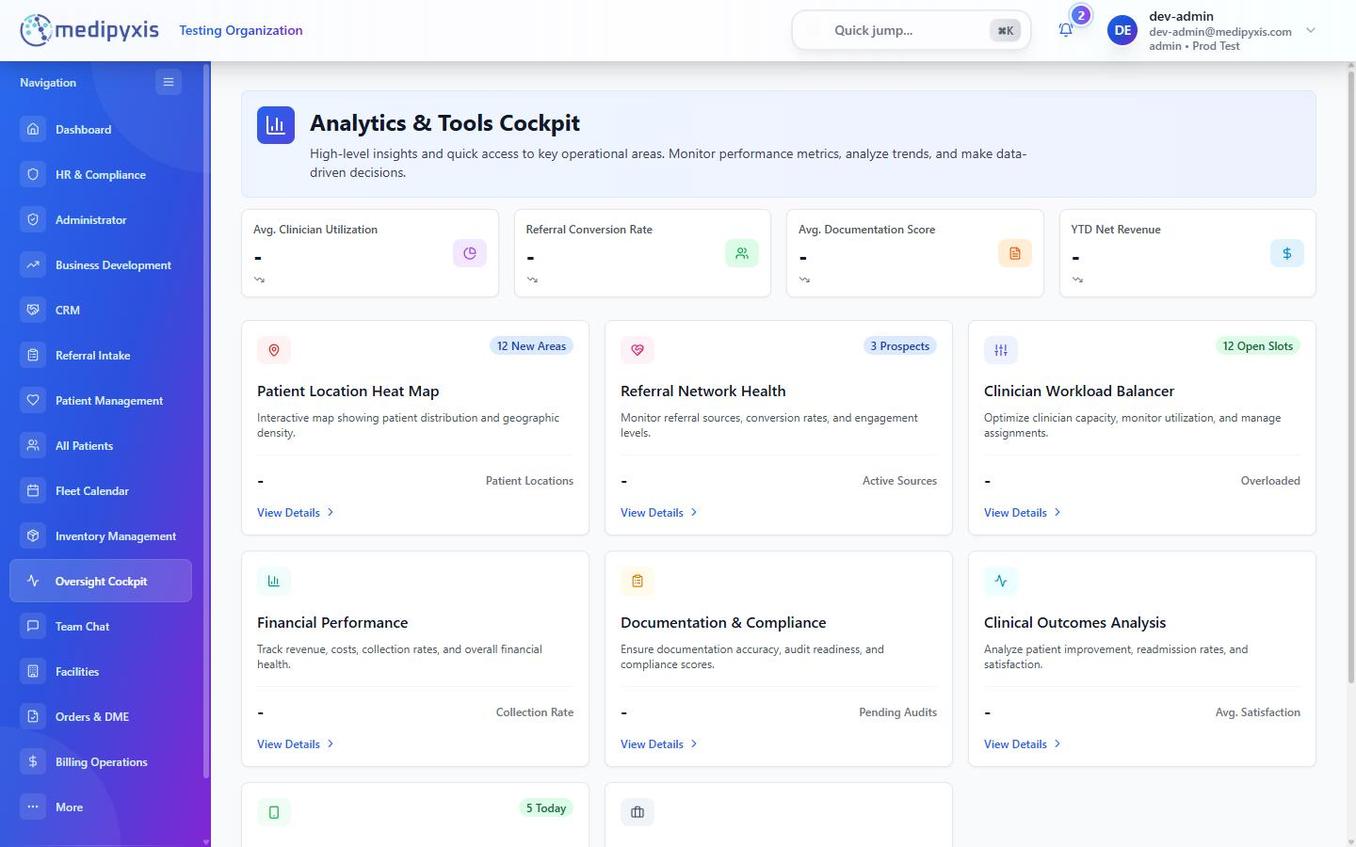
The Oversight Cockpit heat map. A metric selector chooses what the map plots; a date-range selector scopes the data.
Metric views
A selector at the top switches what the map shows. Two views are live today:
| View | What it plots |
|---|---|
| Patients vs Employees | Patient density as clustered markers, with clinician home locations as pins. A status strip shows the patient count, clinician (employee) count, and how many records were excluded because they couldn't be geocoded. Use it to spot coverage gaps and balance territories. |
| Revenue by Zip | Insurance payments received, aggregated by ZIP code and drawn as color- and size-scaled bubbles. See Financial Performance. |
Additional metric options appear in the selector marked as coming soon.
Date range
The Revenue by Zip view includes a date-range selector — Last 30 days, 90 days, 180 days, this year, or year-to-date — so you can compare recent revenue geography against a longer window.
Related
Auto-rendered from related: in frontmatter.