The Dashboard at a glance
Your Dashboard is the first screen you see after login. It summarizes the work waiting for you today and deep-links into every module.
What you see
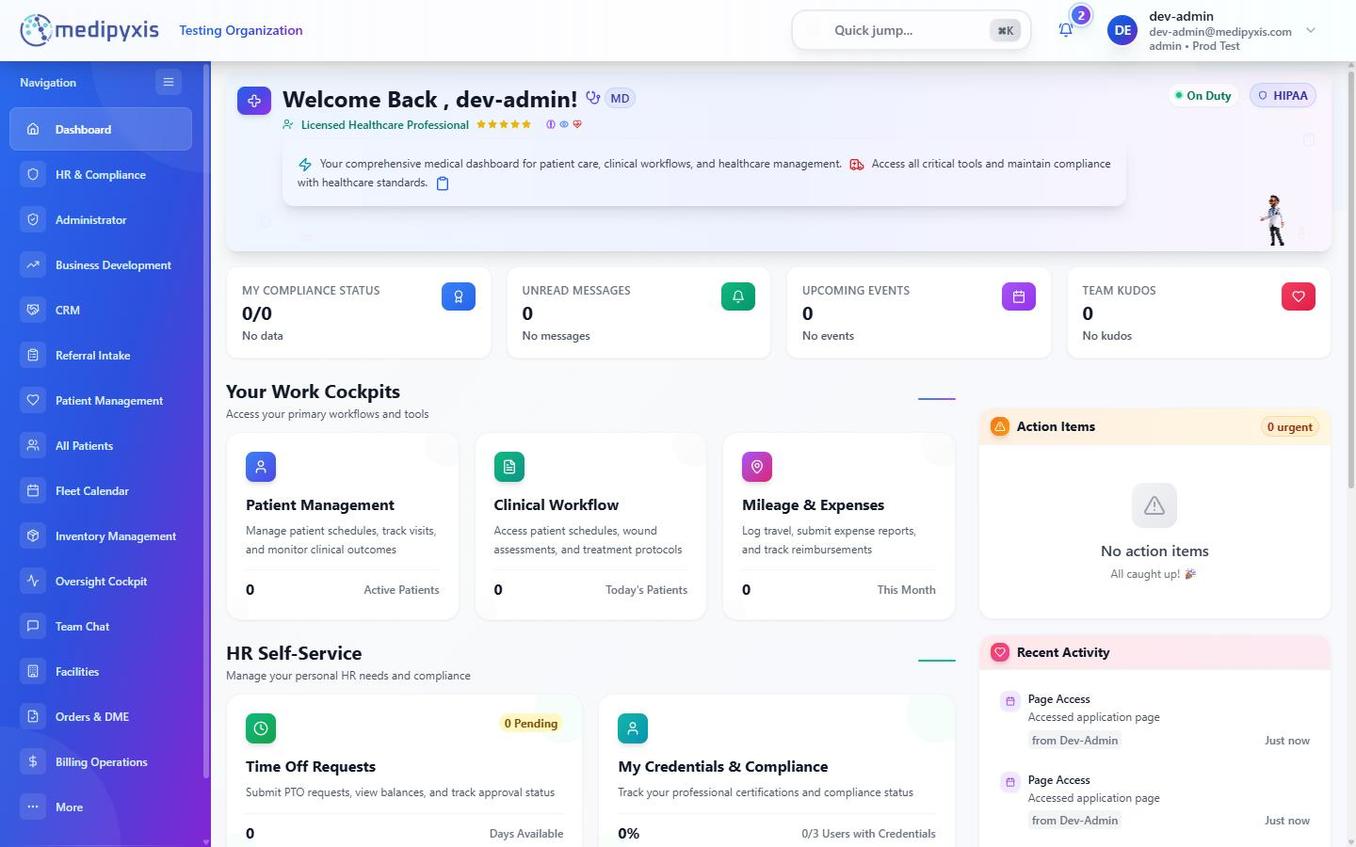
- Welcome Back banner. Shows your name, current facility, and an On Duty pill. The HIPAA badge next to your profile confirms your session is audit-logged.
- Action tiles — dynamic cards for referrals needing review, visits scheduled today, denials needing appeal, and credentials expiring.
- Sidebar (left) — module links. Your visible items depend on your role; a biller will not see Fleet Calendar, a BD rep will not see Billing Operations.
- Top bar — Organization Selector, Quick Jump (⌘K), Notifications bell, Profile menu.
How tiles are prioritized
Tiles surface by urgency, not by module. A STAT referral from 20 minutes ago beats a routine visit scheduled for next week.
- Red border — SLA breach or today-blocker.
- Yellow — due today.
- Grey — informational / caught up.
Personalize
Click the gear in any tile header to hide or pin it. Click Reset in the profile menu to restore defaults.